A/B testing is the practice of showing two variants of the same web page to different segments of visitors at the same time and comparing which variant drives more conversions. In an A/B test, the most important thing is goals that decide a winning test. So, if can we do proper QA/Troubleshoot to check each goal are working that will serve our AB tasting purpose well.
We work hard to make AB test work in properly, but sometimes technology doesn’t work the way you expect it to. For those less-happy moments, VWO provides several ways to troubleshoot your experiment or campaign.
Tools for QA:
Result page: helps you to view result for each goal and the good news is that it updates the result immediately.
Network console: helps you verify whether events in a live experiment are firing correctly.
Browser cookie: helps you verify whether events in a live experiment are firing correctly. It’s stored all the information about all types of goals.
Among all of them, I will say the browser cookie is your best friend. This contains all the information that developers need for troubleshooting experiments, audiences and goals QA.
Browser cookie:
VWO log all records events that occur as you interact with a page on your browser’s cookie. When you trigger an event in VWO it fires a tracking call and stores that information on the browser’s cookie.
To access on browser cookie tab:
Right-click on the page. From the dropdown menu, select Inspect in Chrome or Inspect Element in Firefox.
Select the Application/Storage tab.
Select the Cookies tab.
Select the Domain name of your site.
Filter with “_vis_opt_exp_”.
More specific for a campaign filter with “_vis_opt_exp_{CAMPAIGNID}_goal_”.
You can see the list of all events (all types of goals like click, custom, transection etc) that fired. VWO has a specific number of each goal. I have highlighted the events for few goals on the below screenshot.
VWO stores almost all information (that needed for a developer to troubleshoot) in the browser cookies; like experiments, audiences/segments, goals, users, referrers, session etc. You can find the details about VWO cookies from here.
Network console:
The network panel is a log in your browser that records events that occur as you interact with a page. When you trigger an event in VWO it fires a tracking call, which is picked up in the network traffic.
To access on network tab:
Right-click on the page. From the dropdown menu, select Inspect in Chrome or Inspect Element in Firefox.
Select the Network tab.
Filter with “ping_tpc”.
Click to fire the event you’d like to see the details.
You can see the list of all events that fired. I have highlighted the event that has a specific experiment and goal ID on the below screenshot.
Note: If have already bucketed in an experiment and fired few goals you might not see any network calls. So always go to a fresh incognito browser to troubleshoot goals/experiments.
As VWO immediately update campaign results so it’s always another good option to check result page. But make sure you are the only visitor at that time who is seeing the experiment.
A/B testing is a marketing technique that involves comparing two versions of a web page or application to see which performs better. AB test developing within AB Tasty has few parallels with conventional front-end development. Where the most important thing is goals that decide a winning test. So, if can we do proper QA/Troubleshoot to check each goal are working that will serve our AB tasting purpose well.
We work hard to make AB test work in properly, but sometimes technology doesn’t work the way you expect it to. For those less-happy moments, AB Tasty provides several ways to troubleshoot your experiment or campaign.
Tools for QA:
Preview link: helps you to view variation and move one variation to another, you can also track click goals by enabling “Display Click tracking info’s”.
Network console: helps you verify whether events in a live experiment are firing correctly.
Local storage: helps you verify whether events in a live experiment are firing correctly. It’s stored all the information about all click & custom goals.
Among all of them, I will say the network tab is your best friend. This contains all the information that developers need for troubleshooting experiments, audiences, goals QA and code execution on page load.
Network console:
The network panel is a log in your browser that records events that occur as you interact with a page. When you trigger an event in AB Tasty it fires a tracking call, which is picked up in the network traffic.
To access on network tab:
Right-click on the page. From the dropdown menu, select Inspect in Chrome or Inspect Element in Firefox.
Select the Network tab.
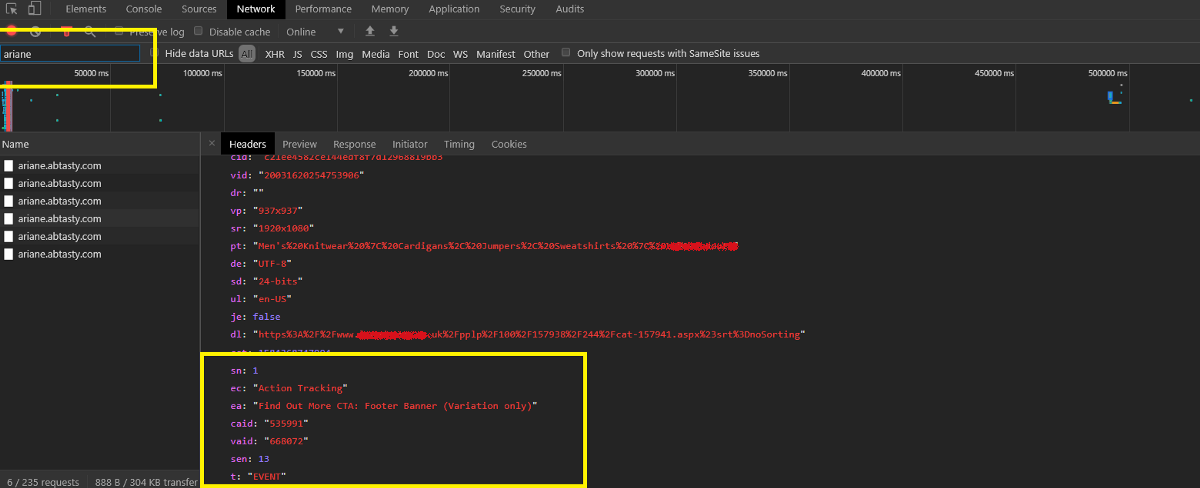
Filter with “datacollectAT” or “ariane.abtasty”.
Click to fire the event you’d like to see the details.
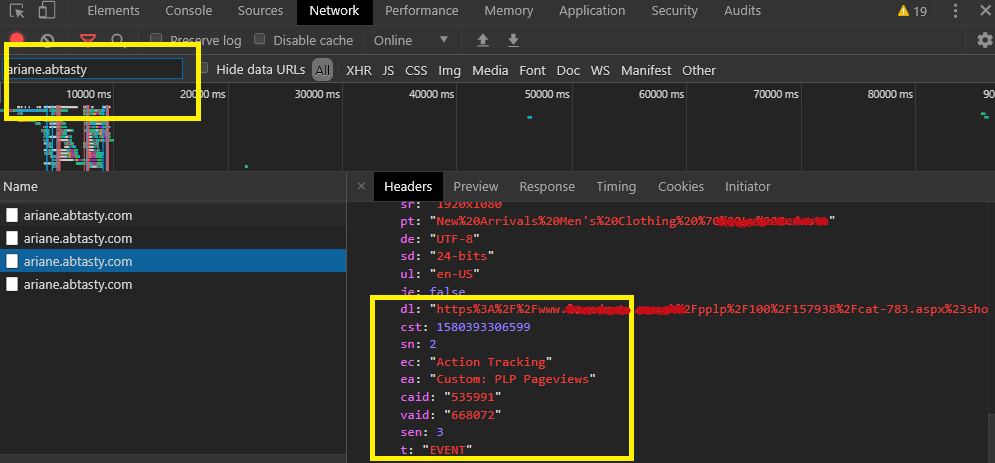
You can see the list of all events(click/custom/transection) that fired. I have highlighted the events name for click/custom goals on the bellow screenshot.
Custom goals are work with the same API call as click goals (so it’s also tracked as an event). That’s why we add a text ‘Custom’ before all custom goals to differentiate between click and custom goals.
You can see the list of custom events that fired on the bellow screenshot.
Local storage:
AB tasty log all records events that occur as you interact with a page on your browser Local storage. When you trigger an event in AB Tasty it fires a tracking call and stores that information on browser local storage.
To access on Local storage tab:
Right-click on the page. From the dropdown menu, select Inspect in Chrome or Inspect Element in Firefox.
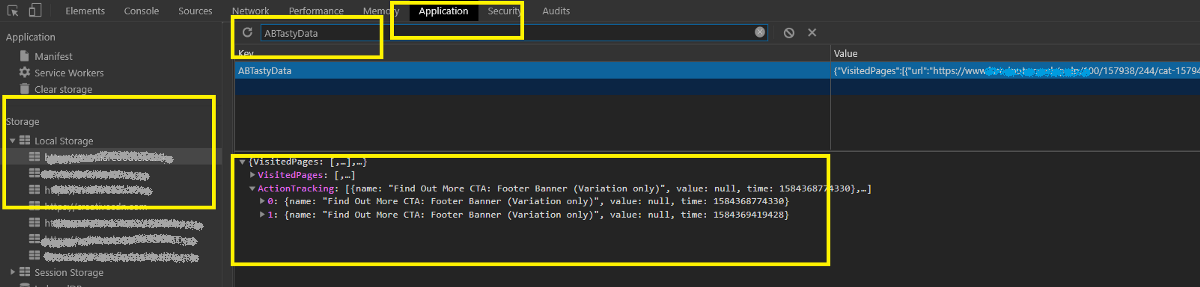
Select the Application/Storage tab.
Select the Local storage tab.
Select the Domain name of your site.
Filter with “ABTastyData”.
Click to ABTastyData you’d like to see the details.
You can see the list of all events(click/custom/transection) that fired. I have highlighted the events name for click/custom goals on the bellow screenshot.
Note: For pageview goal, we have to rely on AB Tasty campaign result page, but the bad news is that it does not update immediately, need to wait 3-4 hours to see the reflections.
We cannot check pageview for AB Tasty by Network console/ Local storage as it’s work differently; It’s tracked the page URL for each of the page and record under each campaign(It has other benefits, like; we can filter the result with any URL without adding it as a pageview goal). AB Tasty manipulates all the goal along with the pageview goals in a certain period and updates that specific campaign results.
A/B testing is a marketing technique that involves comparing two versions of a web page or application to see which performs better. AB test developing within AB Tasty has few parallels with conventional front-end development. Where the most important thing is goals that decide a winning test. So, if can we do proper QA/Troubleshoot to check each goal are working that will serve our AB tasting purpose well.
We work hard to make AB test work in properly, but sometimes technology doesn’t work the way you expect it to. For those less-happy moments, AB Tasty provides several ways to troubleshoot your experiment or campaign.
Tools for QA:
Preview link: helps you to view variation and move one variation to another, you can also track click goals by enabling “Display Click tracking info’s”.
Network console: helps you verify whether events in a live experiment are firing correctly.
Local storage: helps you verify whether events in a live experiment are firing correctly. It’s stored all the information about all click & custom goals.
Among all of them, I will say the network tab is your best friend. This contains all the information that developers need for troubleshooting experiments, audiences, goals QA and code execution on page load.
Network console:
The network panel is a log in your browser that records events that occur as you interact with a page. When you trigger an event in AB Tasty it fires a tracking call, which is picked up in the network traffic.
To access on network tab:
Right-click on the page. From the dropdown menu, select Inspect in Chrome or Inspect Element in Firefox.
Select the Network tab.
Filter with “datacollectAT” or “ariane.abtasty”.
Click to fire the event you’d like to see the details.
You can see the list of all events(click/custom/transection) that fired. I have highlighted the events name for click/custom goals on the bellow screenshot.
Custom goals are work with the same API call as click goals (so it’s also tracked as an event). That’s why we add a text ‘Custom’ before all custom goals to differentiate between click and custom goals.
You can see the list of custom events that fired on the bellow screenshot.
Local storage:
AB tasty log all records events that occur as you interact with a page on your browser Local storage. When you trigger an event in AB Tasty it fires a tracking call and stores that information on browser local storage.
To access on Local storage tab:
Right-click on the page. From the dropdown menu, select Inspect in Chrome or Inspect Element in Firefox.
Select the Application/Storage tab.
Select the Local storage tab.
Select the Domain name of your site.
Filter with “ABTastyData”.
Click to ABTastyData you’d like to see the details.
You can see the list of all events(click/custom/transection) that fired. I have highlighted the events name for click/custom goals on the bellow screenshot.
Note: For pageview goal, we have to rely on AB Tasty campaign result page, but the bad news is that it does not update immediately, need to wait 3-4 hours to see the reflections.
We cannot check pageview for AB Tasty by Network console/ Local storage as it’s work differently; It’s tracked the page URL for each of the page and record under each campaign(It has other benefits, like; we can filter the result with any URL without adding it as a pageview goal). AB Tasty manipulates all the goal along with the pageview goals in a certain period and updates that specific campaign results.
AB test development within Optimizely is delightful and seamless. Front end testing development has few similarities with the conventional front-end development work. However, the most important thing is the goals or metrics that decide the result of the test. We need to do proper QA/Troubleshoot to check each goal; that they are working as expected as otherwise, the whole development of the testing work would be meaningless.
We work hard to make a test work in properly, but sometimes technology doesn’t work the way you expect it to. In this article, I have provided a list of five options that Optimizely provides to troubleshoot your experiment or campaign.
Tools for QA:
Preview tool: helps you check the experiments and campaigns functionality visual changes for different audiences and events fire details.
JavaScript API: helps you verify what live experiments and campaigns are running on a page and which variation you’re bucketed into.
Network console: helps you verify whether events in a live experiment or campaign are firing correctly.
Optimizely’s cookies and localStorage: helps you to uniquely identify visitors, track their actions, and deliver consistent experiences across page loads.
Optimizely log: helps you diagnose more difficult issues in a live experiment or campaign. It tells you about the activated experiment or campaign on the page, qualified audience, applied changes on a page and even events that are fired on each action.
Among all of them, I will say the Optimizely log is your best friend. This log contains all the information that developers need for troubleshooting experiments, segments, audiences, goals and code execution on page load.
I would like to discuss this Optimizely log with a few examples. If your requirements do not serve with this, you can go with other options available in the above links.
Optimizely log:
The Optimizely log allows you to “read Optimizely’s mind” by printing the execution of targeting and activation decisions, variation changes, events, and third-party integrations on a page in your browser’s console.
Use the Optimizely log to investigate all kind of issues, even those issues that you can’t easily diagnose. For goals QA, it is the best weapon in Optimizely.
The log can help you to check:
Is an experiment or campaign loading correctly?
Is the user qualified for an audience condition?
Are the changes you made, applied on the page?
Is the page activated on the URL(or specific condition)?
Is a click/custom goal fired?
You can check all of this with the Optimizely log. But here; I will show the example for page activation (Pageview goals) and click/custom goal.
You can access the log in two ways:
With a query parameter: Add this query parameter to the URL and reload, boom!!
optimizely_log=info
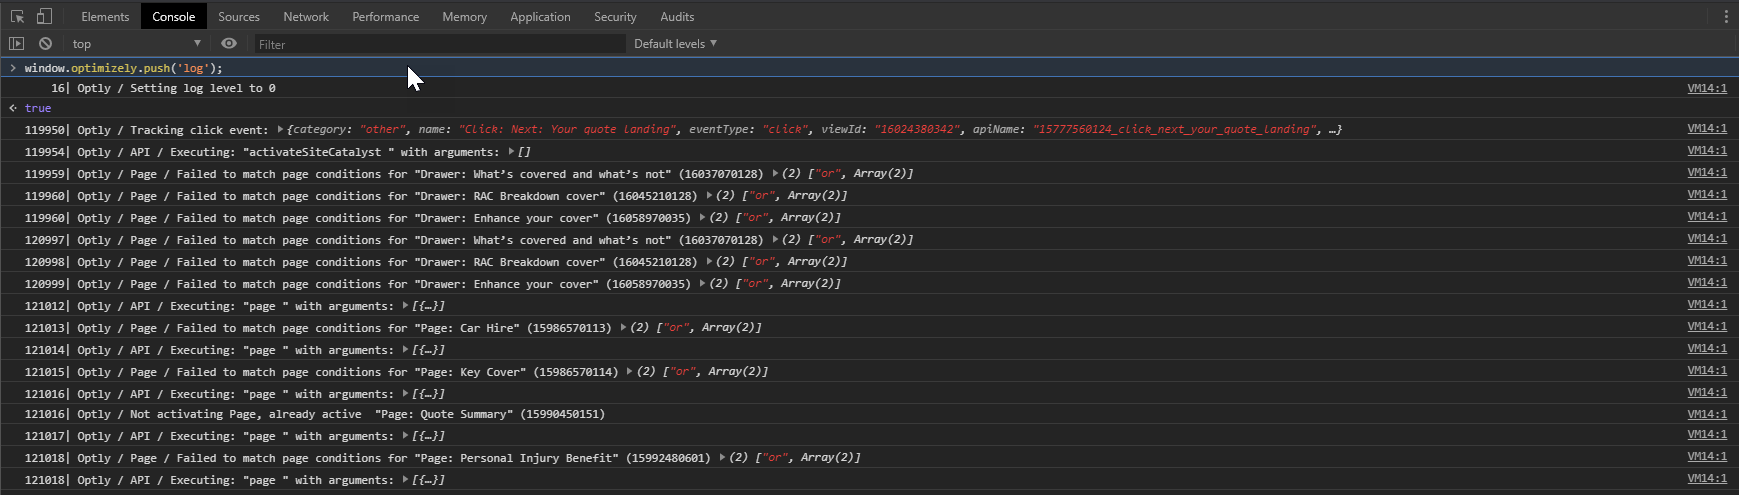
With the JavaScript API: Paste it to browser console and hit enter.
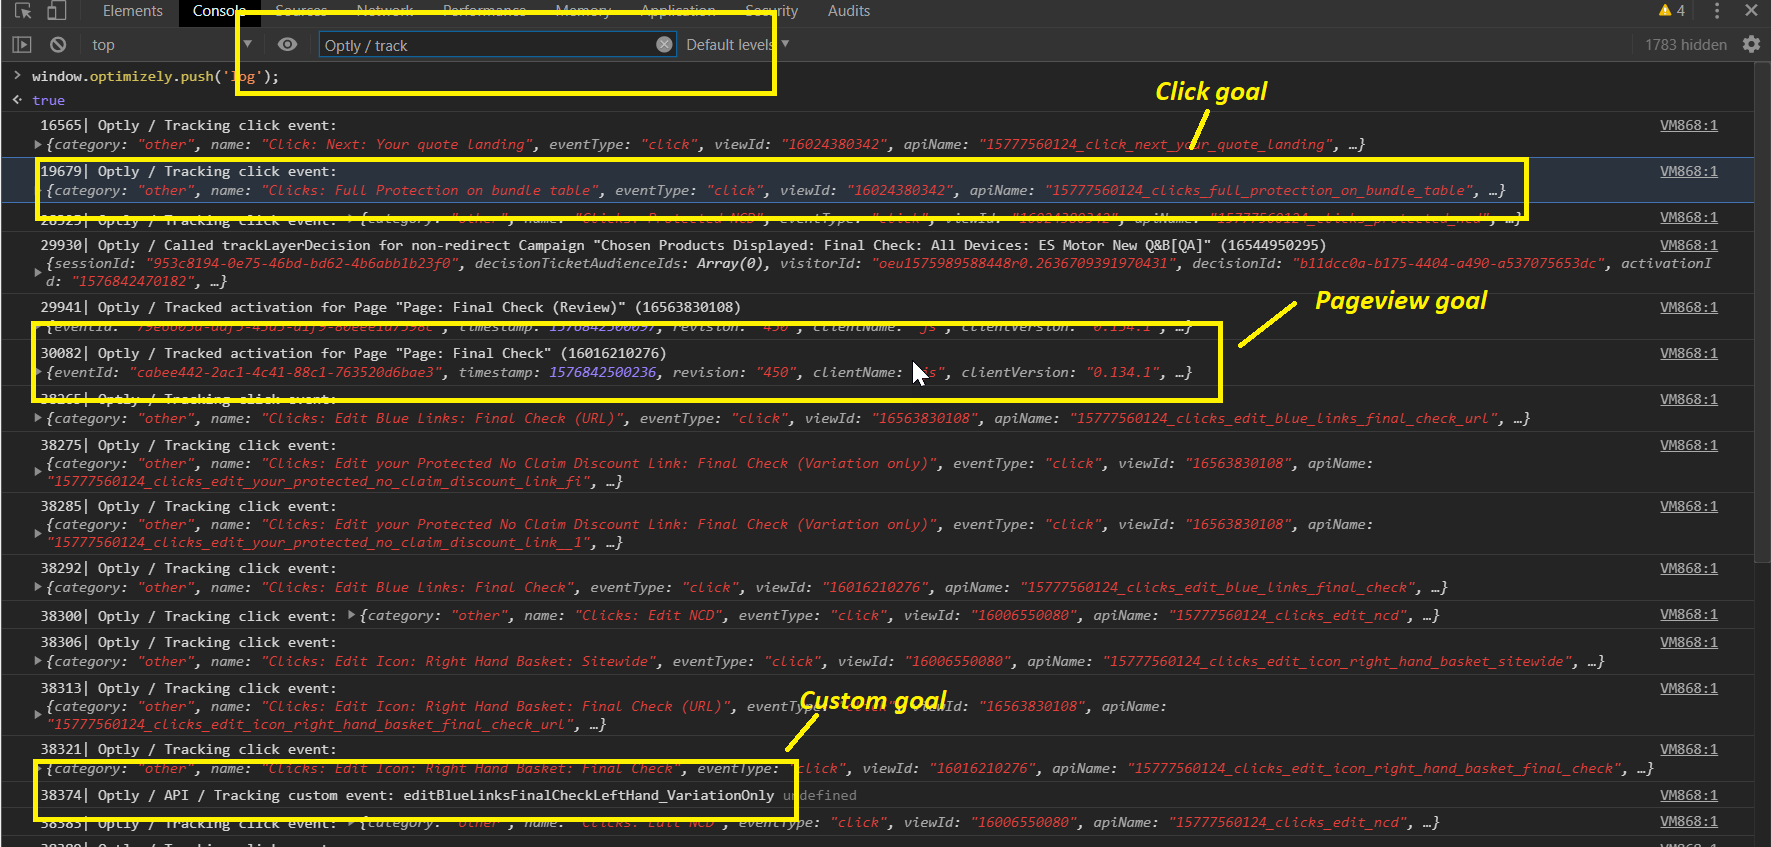
window.optimizely.push('log');
This will then return something like:
For pageview / click/ custom goal filter the console with “Optly / Track”. I have highlighted on the bellow screenshot for click/pageview/custom goals simultaneously.
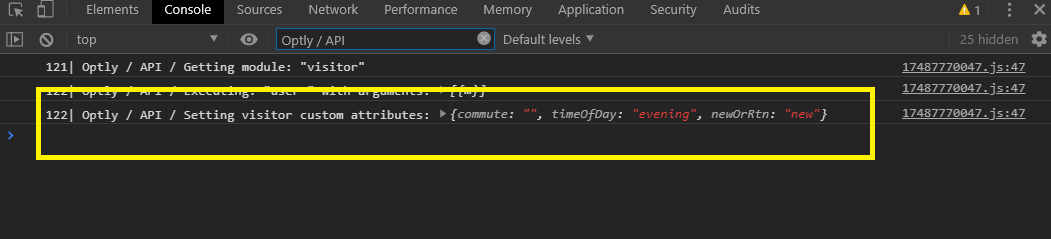
For custom segments/attributes filter the console with “Optly / API”. I have highlighted on the below screenshot for custom segments.
Remember; custom segments could only fire once for a session. So, you might need to check in a new private window each time; to see the custom segments are working.
Reference: If you specifically troubleshoot for the audience, page, campaign, traffic allocation & bucketing, variation code and click/custom goals visit here.
AB test development within Optimizely is delightful and seamless. Front end testing development has few similarities with the conventional front-end development work. However, the most important thing is the goals or metrics that decide the result of the test. We need to do proper QA/Troubleshoot to check each goal; that they are working as expected as otherwise, the whole development of the testing work would be meaningless.
We work hard to make a test work in properly, but sometimes technology doesn’t work the way you expect it to. In this article, I have provided a list of five options that Optimizely provides to troubleshoot your experiment or campaign.
Tools for QA:
Preview tool: helps you check the experiments and campaigns functionality visual changes for different audiences and events fire details.
JavaScript API: helps you verify what live experiments and campaigns are running on a page and which variation you’re bucketed into.
Network console: helps you verify whether events in a live experiment or campaign are firing correctly.
Optimizely’s cookies and localStorage: helps you to uniquely identify visitors, track their actions, and deliver consistent experiences across page loads.
Optimizely log: helps you diagnose more difficult issues in a live experiment or campaign. It tells you about the activated experiment or campaign on the page, qualified audience, applied changes on a page and even events that are fired on each action.
Among all of them, I will say the Optimizely log is your best friend. This log contains all the information that developers need for troubleshooting experiments, segments, audiences, goals and code execution on page load.
I would like to discuss this Optimizely log with a few examples. If your requirements do not serve with this, you can go with other options available in the above links.
Optimizely log:
The Optimizely log allows you to “read Optimizely’s mind” by printing the execution of targeting and activation decisions, variation changes, events, and third-party integrations on a page in your browser’s console.
Use the Optimizely log to investigate all kind of issues, even those issues that you can’t easily diagnose. For goals QA, it is the best weapon in Optimizely.
The log can help you to check:
Is an experiment or campaign loading correctly?
Is the user qualified for an audience condition?
Are the changes you made, applied on the page?
Is the page activated on the URL(or specific condition)?
Is a click/custom goal fired?
You can check all of this with the Optimizely log. But here; I will show the example for page activation (Pageview goals) and click/custom goal.
You can access the log in two ways:
With a query parameter: Add this query parameter to the URL and reload, boom!!
optimizely_log=info
With the JavaScript API: Paste it to browser console and hit enter.
window.optimizely.push('log');
This will then return something like:
For pageview / click/ custom goal filter the console with “Optly / Track”. I have highlighted on the bellow screenshot for click/pageview/custom goals simultaneously.
For custom segments/attributes filter the console with “Optly / API”. I have highlighted on the below screenshot for custom segments.
Remember; custom segments could only fire once for a session. So, you might need to check in a new private window each time; to see the custom segments are working.
Reference: If you specifically troubleshoot for the audience, page, campaign, traffic allocation & bucketing, variation code and click/custom goals visit here.